by Drew Thompson | Jul 23, 2024 | Industry, News Feed
At Inman Connect Las Vegas, July 30-Aug. 1 2024, the noise and misinformation will be banished, all your big questions will be answered, and new business opportunities will be revealed. Join us.
Home price appreciation should slow dramatically next year if listings continue to surge but would-be homebuyers still have trouble finding properties that they can afford, economists say.
Economists at Fannie Mae and the Mortgage Bankers Association are predicting that annual home price appreciation will fall to about 3 percent by the final quarter of 2025, less than half the current rate. That’s a national forecast, so many local markets where supply exceeds demand could see price declines — some already have.
Realtor.com data shows active for-sale listings were up 37 percent in June from a year ago, but the pace of sales remains subdued, Fannie Mae economists said Tuesday in commentary accompanying the release of their latest economic and housing forecasts.
The National Association of Realtors reported Tuesday that June home sales were down 5.4 percent from a year ago and that the median sales price was up 4.1 percent from a year ago, to an all-time high of $462,900.

Doug Duncan
“The housing market continues to wait for affordability to improve, even as the supply of new and existing homes for sale slowly rises,” Fannie Mae Chief Economist Doug Duncan said in a statement. “The slight decline in mortgage rates of late, following data pointing to gradually slowing economic growth, has not been enough to overcome the significant affordability constraints imposed on would-be homebuyers.”
TAKE THE INMAN INTEL INDEX SURVEY FOR JULY
Home prices have shown surprising strength this year, with Fannie Mae’s Home Price Index projected to show home values rose 6.9 percent from a year ago during the second quarter.
But markets where listings are still below pre-pandemic levels are experiencing the strongest price appreciation. In some markets where listings have surged past pre-pandemic levels, home prices are already starting to come down, Fannie Mae economists noted, citing Zillow data.
Zillow data shows home prices continued to appreciate in 46 of the 50 largest metro areas in June, led by San Jose (12 percent), Hartford (10.5 percent), San Diego (9.4 percent), Providence (7.7 percent) and Los Angeles (7.6 percent).
But Zillow reported home values were down from a year ago in June in four big metros: New Orleans (-6 percent), Austin (-4.6 percent), San Antonio (-2.7 percent), and Birmingham (-0.6 percent).
“Many large metros in the Sunbelt … now have inventory levels that match or even exceed for-sale inventories in 2019,” Fannie Mae economists said, with total inventories in Florida and Texas “at or even a bit above” where they were before the pandemic.
“We continue to expect home price growth on a national level to decelerate – but remain positive — over the near term, but it should be noted that conditions often vary by region, particularly as it relates to supply,” Duncan said. “For instance, many Sunbelt metros are currently seeing significant increases in for-sale inventories, in part due to new construction, while supply in much of the Northeast and Midwest remains extremely tight.”
The varied market conditions have Fannie Mae economists predicting that new home sales will decline slightly this year, while sales of existing homes may see only a small bump. Sales of new and existing homes are expected to climb 9.3 percent next year.
Home price appreciation expected to cool
In their first update of their forecast for home price appreciation since April, Fannie Mae economists said they expect home price appreciation will cool to 6.1 percent by the end of this year and to 3 percent by Q4 2024. Due largely to the unexpected strength in home prices so far this year, that’s up from 4.8 percent and 1.5 percent in the April forecast.
“We have modestly upgraded our home price outlook for 2024 largely based on these stronger incoming data for the first half of the year, but we continue to expect deceleration going forward as affordability constraints weigh on home purchase demand,” Fannie Mae economists said.
In a July 19 forecast, economists at the Mortgage Bankers Association (MBA) laid out a similar path for national home price appreciation to fall to 4.5 percent annually by Q4 2024 and 3.3 percent by the end of next year.
Mortgage rates projected to ease
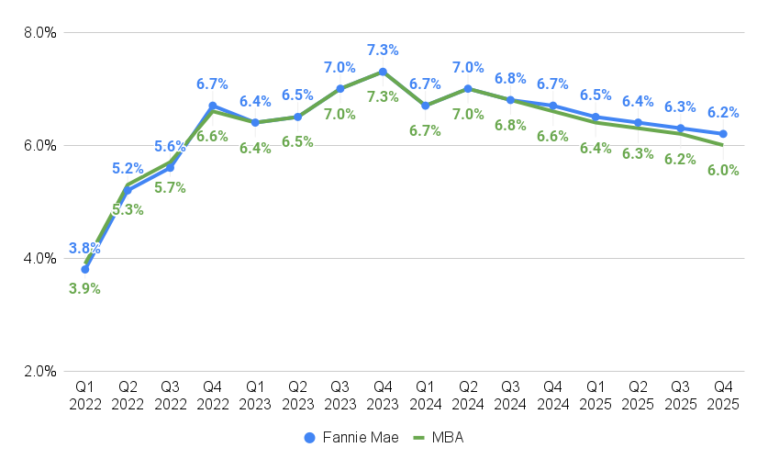
MBA and Fannie Mae forecasters are also aligned in their expectations that mortgage rates will continue retreating below 7 percent this year and next.
Fannie Mae economists project rates on 30-year fixed-rate mortgages will decline to an average of 6.7 percent during Q4 2024 and to 6.2 percent by Q4 2025.
The MBA’s slightly more optimistic forecast envisions rates averaging 6.6 percent in Q4 2024 before falling to 6.0 percent during Q4 2025.
Fannie Mae economists say they now expect the Federal Reserve to cut rates in both September and December, due to two consecutive lower-than-expected prints of the Consumer Price Index and signs the jobs market is cooling.
Economists at the mortgage giant expect the Fed’s preferred inflation gauge, the core Personal Consumption Expenditures (PCE) Index, to end the year at 2.5 percent — half a percentage point above its 2 percent target. The PCE price index fell to 2.6 percent in May and data for June will be released July 26.
Home sales expected to rebound in 2025
Fannie Mae economists are more pessimistic about the outlook for new home sales this year and next than their counterparts at the MBA, citing the likelihood that builders will pull back in Sunbelt markets where listings of existing homes are on the upswing.
Fannie Mae is forecasting new home sales will fall 4 percent this year, to 639,000, before rebounding by 12 percent next year, to 716,000.
“While metro-area single-family construction permitting data does not yet show a meaningful slowdown in new construction in the regions with the greatest growing supply of existing listings, historically, a looser resale market leads to a slowdown in new construction,” Fannie Mae forecasters said. “We have therefore modestly moved downward our single-family starts and new home sales forecasts to reflect comparative weakening in some of the top-building metros.”
The MBA is forecasting 6 percent growth in 2024 new home sales and another 13 percent surge in 2025, which would mean builders would have to sell 800,000 new homes in 2025 — 84,000 more than forecast by Fannie Mae.
Homebuilders’ margins “have been strong enough that they appear willing to help drive sales by offering consumers more incentives, so we are still expecting comparatively robust new construction over our forecast horizon — but more modest than previously forecast,” Fannie Mae economists said.
Both Fannie Mae and the MBA see sales of existing homes rebounding to around 4.5 million next year as appreciation slows and prices in some markets come down.
Fannie Mae’s forecast of 5.25 million sales of new and existing homes next year would represent 9.3 percent growth, while the MBA’s higher 2024 baseline has total home sales rising 7.2 percent next year, to 5.29 million.
While Fannie Mae hasn’t issued a forecast for 2026, MBA economists expect home sales to grow by an additional 5 percent to 5.55 million two years from now.
Get Inman’s Mortgage Brief Newsletter delivered right to your inbox. A weekly roundup of all the biggest news in the world of mortgages and closings delivered every Wednesday. Click here to subscribe.
Email Matt Carter
by Andy Florance | Jul 23, 2024 | Industry, News Feed
The median existing-home price jumped by 4.1 percent year-over-year to $426,900 for all housing types, marking the second month of record highs.
At Inman Connect Las Vegas, July 30-Aug. 1 2024, the noise and misinformation will be banished, all your big questions will be answered, and new business opportunities will be revealed. Join us.
In June, existing-home sales continued to decline across four U.S. regions while the median existing-home price reached a record high for the second consecutive month, according to data released Friday by the National Association of Realtors (NAR).
The median existing-home price jumped by 4.1 percent in June 2023 to $426,900 for all housing types, a record high for the second consecutive month and the 12th consecutive month with year-over-year price increases showing in all four U.S. regions.
Existing-home sales declined 5.4 percent nationally between May and June to an annual rate of 3.89 million, and were down from 4.11 million a year previous.
“We’re seeing a slow shift from a seller’s market to a buyer’s market,” NAR Chief Economist Lawrence Yun said. “Homes are sitting on the market a bit longer, and sellers are receiving fewer offers. More buyers are insisting on home inspections and appraisals, and inventory is definitively rising on a national basis.”
The total housing inventory registered at the end of June was 1.32 million units, up 3.1 percent from May and up 23.4 percent from a year before. The total of unsold inventory represents a supply of 4.1 months at the current sales pace, according to NAR.
According to the Realtors Confidence Index, properties typically remained on the market for 22 days in June, down from 24 days in May and up from 18 days the previous year.
“Some 1.32 million homes were on the market at the end of June, and that’s a quarter of a million more than 12 months earlier,” Holden Lewis, home and mortgage expert at NerdWallet, said. “Each month, buyers have more inventory to choose from, and eventually this dynamic will keep house prices from rising so fast.”
In the Northeast, existing-home sales declined 2.1 percent between May and June to an annual rate of 470,000, down 6 percent from the previous year. In the South, existing-home sales declined 5.9 percent from May to an annual rate of 1.76 million in June, down 6.9 percent from the year before.
Existing-home sales in the Midwest declined 8 percent to an annual rate of 920,000 in June, down 6.1 percent from a year before. In the West, sales dropped 2.6 percent to an annual rate of 740,000, identical to the year prior.
“Homebuying is likely to remain a cornerstone of the American dream. However, relatively steady rent, at a level that is up more than 20 percent compared to five years ago, and rising home prices make it challenging for aspiring owners to break into the market,” Realtor.com Chief Economist Danielle Hale said.
“An increase in new home construction, which would boost supply, and a reduction in the cost of borrowing, which we’ve started to see and expect to continue, should help improve conditions for buyers and thus the number of home sale transactions in the months ahead.”
Email Richelle Hammiel
by Richelle Hammiel | Jul 23, 2024 | Industry, News Feed
At Inman Connect Las Vegas, July 30-Aug. 1, 2024, the noise and misinformation will be banished, all your big questions will be answered, and new business opportunities will be revealed. Join us.
Some of homeownership’s largest hidden costs, including property taxes and homeowners insurance, are the biggest factors contributing to a growing number of mortgage delinquencies, a survey from Auction.com shows.
Hidden costs, like property taxes and homeowners insurance, were given a 37 percent risk factor for triggering mortgage delinquency by leaders in default servicing, according to the survey, making it the highest-ranked risk factor.
Consumer debt delinquencies were also ranked high at 32 percent, followed by rising unemployment at 15 percent, commercial mortgage defaults at 10 percent and falling home prices at 6 percent.
Auction.com’s survey was conducted in April. Respondents included banks, nonbanks, mortgage asset owners and investors, government agencies and government-sponsored enterprises.

Insurance costs have surged in many parts of the country in recent years, even as major insurance companies have pulled out of what are seen as high-risk states, like California and Florida.
Homeowners’ insurance costs nationally rose 33.8 percent from 2018 through 2023, according to S&P Global Market Intelligence. In Texas, rates jumped 60 percent during that period, while rates rose more than 50 percent across Colorado, Arizona and Utah.
Climate change and the risk associated with it has been a major factor contributing to rising costs, Benjamin Collier, an associate professor of risk management and insurance at Temple University, told Realtor.com.
“A major reason is climate risk, and that insurers have had broad losses from severe climate events over the past few years from hurricanes and severe storms,” Collier said. “If you look at places where insurers have been paying out more claims than taking in premiums over the last couple years, it’s half the states.”
Inflation in construction costs has also added to rising insurance premiums, Collier noted. But, more near-term, higher insurance rates are more likely to affect mortgage delinquencies in regions that have seen an uptick in climate-related events in recent years, he said.
“My expectation is that these challenges would be greatest in higher-risk areas, because those higher-risk areas are where we’re seeing insurance prices climb the fastest,” Collier told Realtor.com. “I also think that this problem might be greater for lower-income households in those areas, who are often living and working much closer to the edge of their available budget.”
On top of rising home insurance costs, many homeowners are also dealing with rising property taxes as a result of surging home values. Last year, the average tax on single-family homes in the U.S. rose 4.1 percent to $4,062, after a 3 percent increase the year before, a report from Attom Data Solutions shows.
The hidden costs of owning and maintaining a single-family home in the U.S. now average more than $18,000 per year, according to Bankrate. That figure translates to about $1,500 per month on top of a mortgage payment, up 26 percent from four years ago.
That’s a lot of additional costs for homeowners, especially for established homeowners who have been accustomed to lower costs during their tenure.
Foreclosure rates remain relatively low
Foreclosure activity has remained relatively low in the U.S., according to Attom, with 177,431 U.S. properties receiving foreclosure filings (including default notices, scheduled auctions or bank repossessions) during the first half of 2024. During the 2008 housing recession, about 15 times as many borrowers faced foreclosure. That figure from the first half of 2024 is also 4.4 percent less than what it was during the first half of 2023.
“Given the low default environment we’re in, this finding serves as an early warning of what could trigger more defaults in the future, especially if we continue to see more natural disaster events that, in turn, put more upward pressure on home insurance rates,” Daren Blomquist, a vice president of market economics at Auction.com, told Realtor.com.
“It’s important to note that even though rising hidden homeownership costs represented the highest risk factor of rising defaults, the majority of our mortgage servicing survey respondents believe that foreclosure volume will rise only modestly for the rest of the year (less than 5 percent),” Blomquist continued. “So these rising hidden homeownership costs represent the highest risk in a low-risk environment.”
If foreclosure rates do start to rise, they may begin in areas where those hidden costs are increasing the most quickly, Auction.com’s survey suggested.
For instance, foreclosure starts surpassed pre-pandemic levels in May in areas of the Gulf Coast, Texas and inland California, according to Blomquist — all areas that have seen storm and wildfire damage in recent years.
Foreclosure starts hit 135 percent of pre-pandemic levels in Houston, Texas; 93 percent of pre-pandemic levels in Riverside-San Bernadino, California; 100 percent of pre-pandemic levels in Tampa-St. Petersburg, Florida; 114 percent of pre-pandemic levels in Orlando, Florida; and 104 percent of pre-pandemic levels in San Antonio, Texas.
Those markets are located in states that are among the top 10 for insurance premium increases between 2018 and 2023, according to Attom’s data.
“Although it’s too early to fully connect the dots, we do see more rapidly rising foreclosure starts in many of the major markets where insurance costs have been rising,” Blomquist said.
“Absent of broader economic or housing market shocks, we would expect the default trend to follow the uneven regional pattern,” he added. “Markets with higher and faster-rising hidden homeownership costs would likely see a bigger increase in defaults. We are already seeing some signs this could be playing out when we look at recent foreclosure start data.”
Email Lillian Dickerson
by Doreen Spagnuolo | Jul 23, 2024 | Industry, News Feed
At Inman Connect Las Vegas, July 30-Aug. 1, 2024, the noise and misinformation will be banished, all your big questions will be answered, and new business opportunities will be revealed. Join us.
Pulse is a recurring column where we ask for readers’ takes on varying topics in a weekly survey and report back with our findings.
Do you need a buyer agreement for open house attendees? Do we have finalized forms yet? Can we post offers of compensation on our websites or through a workaround app? There are plenty of questions floating around out there as we draw closer to the Aug. 17 implementation deadline for the terms of the NAR settlement.
via GIPHY
So we want to know: What looming NAR settlement questions do you still have? Do you have a plan in place for working with buyers, sellers and cooperating colleagues? Has your brokerage provided enough training, or have you gotten your information straight from the local association? Do you feel confident that you have a handle on the day-to-day post-Aug. 17, or are you still struggling to catch up? Let us know below:
We’ll compile a list of the top responses and post them on Inman next Tuesday.
by Robert Palmer | Jul 23, 2024 | Industry, News Feed
Rising home prices and mortgage rates, and sticker shock from surprise housing costs, pushed buyers to cancel 56,000 home-purchase agreements in June, according to Redfin.
At Inman Connect Las Vegas, July 30-Aug. 1, 2024, the noise and misinformation will be banished, all your big questions will be answered, and new business opportunities will be revealed. Join us.
Rising home prices and stubborn mortgage rates are leading a growing number of homebuyers to abandon their home purchasing plans, according to a Redfin report published Tuesday.
In June, median home prices increased 4 percent year over year to an all-time high of $442,525 as 30-year mortgage rate averages hovered just under 7 percent. Those conditions led homebuyers to cancel 56,000 home-purchase agreements — or 14.6 percent of the pending sales for the month.
Florida bore the brunt of the rise in home-purchase cancellations, with more than a fourth of for-sale inventory in Orlando (20.8 percent), Jacksonville (20.5 percent) and Tampa (20.5 percent) falling out of contract in June. Homebuyers in Las Vegas (20.2 percent) and San Antonio (19.9 percent) were also skittish, with roughly 20 percent of contracts kicking the can at the peak of the summer homebuying season.

Rafael Corrales
Redfin Premier agents Rafael Corrales and Julie Zubiate said affordability concerns are the primary culprit, with insurance, property taxes and homeowners association fees giving homebuyers serious sticker shock.
“Buyers often back out during the inspection period because they find something they don’t like, but affordability is really the underlying issue,” he said. “I don’t want my buyers to be surprised by all of the expenses that come with owning a home in Florida, so I advise them to proactively research the hefty costs of insurance, property taxes and HOA fees, in addition to the cost of their mortgage payment.”
Meanwhile, Zubiate said Bay Area buyers have become increasingly picky — a 180 from the pre-pandemic and peak-pandemic trends when homebuyers entered bidding wars for fixer-uppers and even half-burnt lots.

Julie Zubiate
“Buyers are getting more and more selective,” she said. “They’re backing out due to minor issues because the monthly costs associated with buying a home today are just too high to rationalize not getting everything on their must-have list.”
Although homebuyers’ worries got the best of them in June, the report said home purchase cancellations could soon improve as homesellers face longer list-to-sell timelines. Nearly 20 percent of homes (19.8 percent) experienced a price cut in June — the highest rate for the month since 2017.
“Some sellers are reducing their prices because their homes are sitting on the market and getting stale — the result of an ongoing affordability crisis impacting buyers,” the report read. “The typical home that sold in June spent 32 days on the market, the longest of any June since 2020. That’s up three days from a year earlier — the biggest annual increase since last summer.”
Email Marian McPherson
by Amanda York | Jul 23, 2024 | Industry, News Feed
WASHINGTON (July 23, 2024) – Existing-home sales fell in June as the median sales price climbed to the highest price ever recorded for the second consecutive month, according to the National Association of REALTORS®. All four major U.S. regions posted sales declines. Year-over-year, sales waned in the Northeast, Midwest and South but were unchanged in the West.
Total existing-home sales1 – completed transactions that include single-family homes, townhomes, condominiums and co-ops – receded 5.4% from May to a seasonally adjusted annual rate of 3.89 million in June. Year-over-year, sales also dropped 5.4% (down from 4.11 million in June 2023).
“We’re seeing a slow shift from a seller’s market to a buyer’s market,” said NAR Chief Economist Lawrence Yun. “Homes are sitting on the market a bit longer, and sellers are receiving fewer offers. More buyers are insisting on home inspections and appraisals, and inventory is definitively rising on a national basis.”
Total housing inventory2 registered at the end of June was 1.32 million units, up 3.1% from May and 23.4% from one year ago (1.07 million). Unsold inventory sits at a 4.1-month supply at the current sales pace, up from 3.7 months in May and 3.1 months in June 2023. The last time unsold inventory posted a four-month supply was May 2020 (4.5 months).
The median existing-home price3 for all housing types in June was $426,900, an all-time high and an increase of 4.1% from one year ago ($410,100). All four U.S. regions registered price gains.
“Even as the median home price reached a new record high, further large accelerations are unlikely,” Yun added. “Supply and demand dynamics are nearing a balanced market condition. The months supply of inventory reached its highest level in more than four years.”
REALTORS® Confidence Index
According to the monthly REALTORS® Confidence Index, properties typically remained on the market for 22 days in June, down from 24 days in May but up from 18 days in June 2023.
First-time buyers were responsible for 29% of sales in June, down from 31% in May but up from 27% in June 2023. NAR’s 2023 Profile of Home Buyers and Sellers – released in November 20234 – found that the annual share of first-time buyers was 32%.
All-cash sales accounted for 28% of transactions in June, unchanged from May and up from 26% one year ago.
Individual investors or second-home buyers, who make up many cash sales, purchased 16% of homes in June, identical to May and down from 18% in June 2023.
Distressed sales5 – foreclosures and short sales – represented 2% of sales in June, unchanged from last month and the previous year.
Mortgage Rates
According to Freddie Mac, the 30-year fixed-rate mortgage averaged 6.77% as of July 18. That’s down from 6.89% one week ago and 6.78% one year ago.
Single-family and Condo/Co-op Sales
Single-family home sales retracted to a seasonally adjusted annual rate of 3.52 million in June, down 5.1% from 3.71 million in May and 4.3% from the prior year. The median existing single-family home price was $432,700 in June, up 4.1% from June 2023.
Existing condominium and co-op sales tumbled 7.5% in June to a seasonally adjusted annual rate of 370,000 units, down 14% from one year ago (430,000 units). The median existing condo price was $371,700 in June, up 2.6% from the previous year ($362,200).
Regional Breakdown
Existing-home sales in the Northeast in June withdrew 2.1% from May to an annual rate of 470,000, a decline of 6% from June 2023. The median price in the Northeast was $521,500, up 9.7% from one year earlier.
In the Midwest, existing-home sales decreased 8% from one month ago to an annual rate of 920,000 in June, down 6.1% from the prior year. The median price in the Midwest was $327,100, up 5.5% from June 2023.
Existing-home sales in the South slid 5.9% from May to an annual rate of 1.76 million in June, down 6.9% from one year before. The median price in the South was $373,000, up 1.7% from last year.
In the West, existing-home sales declined 2.6% in June to an annual rate of 740,000, identical to a year ago. The median price in the West was $629,800, up 3.5% from June 2023.
About the National Association of REALTORS®
The National Association of REALTORS® is America’s largest trade association, representing 1.5 million members involved in all aspects of the residential and commercial real estate industries. The term REALTOR® is a registered collective membership mark that identifies a real estate professional who is a member of the National Association of REALTORS® and subscribes to its strict Code of Ethics.
# # #
For local information, please contact the local association of REALTORS® for data from local multiple listing services (MLS). Local MLS data is the most accurate source of sales and price information in specific areas, although there may be differences in reporting methodology.
NOTE: NAR’s Pending Home Sales Index for June is scheduled for release on July 31, and Existing-Home Sales for July will be released on August 22. Release times are 10 a.m. Eastern.
1 Existing-home sales, which include single-family, townhomes, condominiums and co-ops, are based on transaction closings from Multiple Listing Services. Changes in sales trends outside of MLSs are not captured in the monthly series. NAR benchmarks home sales periodically using other sources to assess overall home sales trends, including sales not reported by MLSs.
Existing-home sales, based on closings, differ from the U.S. Census Bureau’s series on new single-family home sales, which are based on contracts or the acceptance of a deposit. Because of these differences, it is not uncommon for each series to move in different directions in the same month. In addition, existing-home sales, which account for more than 90% of total home sales, are based on a much larger data sample – about 40% of multiple listing service data each month – and typically are not subject to large prior-month revisions.
The annual rate for a particular month represents what the total number of actual sales for a year would be if the relative pace for that month were maintained for 12 consecutive months. Seasonally adjusted annual rates are used in reporting monthly data to factor out seasonal variations in resale activity. For example, home sales volume is normally higher in the summer than in the winter, primarily because of differences in the weather and family buying patterns. However, seasonal factors cannot compensate for abnormal weather patterns.
Single-family data collection began monthly in 1968, while condo data collection began quarterly in 1981; the series were combined in 1999 when monthly collection of condo data began. Prior to this period, single-family homes accounted for more than nine out of 10 purchases. Historic comparisons for total home sales prior to 1999 are based on monthly single-family sales, combined with the corresponding quarterly sales rate for condos.
2 Total inventory and month’s supply data are available back through 1999, while single-family inventory and month’s supply are available back to 1982 (prior to 1999, single-family sales accounted for more than 90% of transactions and condos were measured only on a quarterly basis).
3 The median price is where half sold for more and half sold for less; medians are more typical of market conditions than average prices, which are skewed higher by a relatively small share of upper-end transactions. The only valid comparisons for median prices are with the same period a year earlier due to seasonality in buying patterns. Month-to-month comparisons do not compensate for seasonal changes, especially for the timing of family buying patterns. Changes in the composition of sales can distort median price data. Year-ago median and mean prices sometimes are revised in an automated process if additional data is received.
The national median condo/co-op price often is higher than the median single-family home price because condos are concentrated in higher-cost housing markets. However, in a given area, single-family homes typically sell for more than condos as seen in NAR’s quarterly metro area price reports.
4 Survey results represent owner-occupants and differ from separately reported monthly findings from NAR’s REALTORS® Confidence Index, which include all types of buyers. The annual study only represents primary residence purchases, and does not include investor and vacation home buyers. Results include both new and existing homes.
5 Distressed sales (foreclosures and short sales), days on market, first-time buyers, all-cash transactions and investors are from a monthly survey for the NAR’s REALTORS® Confidence Index, posted at nar.realtor.