With interactive maps and charts, Inman’s data team helps track the course of 500 local housing markets in this new monthly series.
This is the first installment of Inman Market View, an ongoing monthly data series. The goal: to put more local data in the hands of the Inman community, and to place it in a context that’s highly relevant for the U.S. brokerage industry.
Real estate agents and brokerage leaders are inundated with data each month from dozens of sources.
But that data can often be incomplete, siloed or otherwise difficult to place in a useful context.
That’s why we’re launching Inman Market View, a new interactive project from Inman’s data and news team that seeks to put more local market data directly in the hands of real estate professionals.
This new series aims to allow our Select subscribers to see how their own local market has navigated the treacherous path through a pandemic boom and resultant slowdown, and to compare its path to that of other markets across the country. The tools below utilize listing data from Realtor.com and data wrangling and analysis by the Inman team.
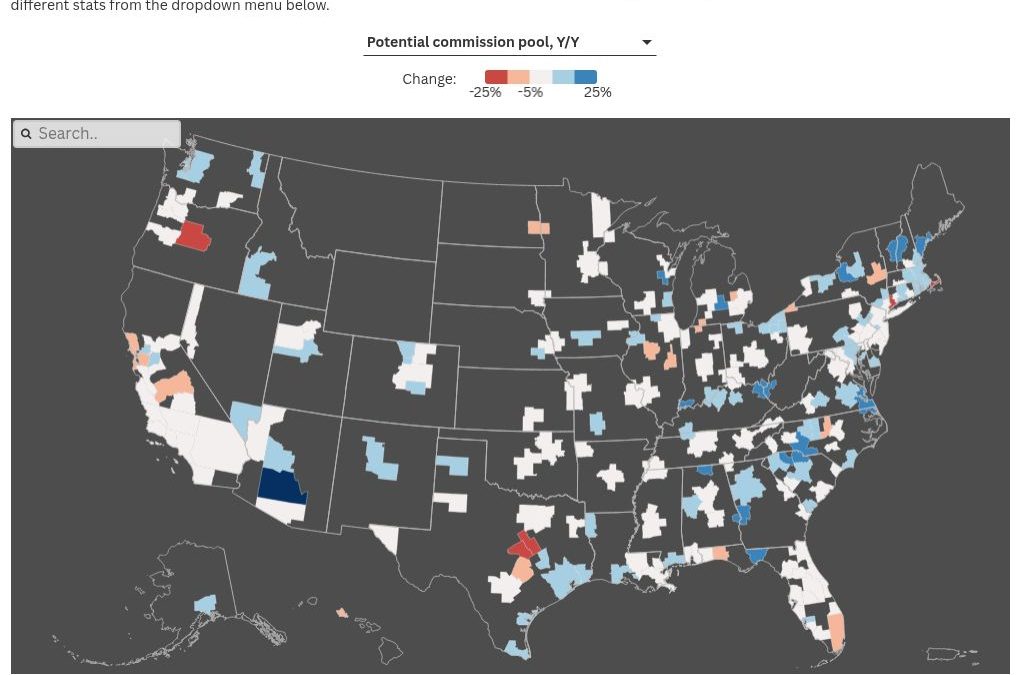
The first result is an interactive map of 500 major metro areas, which together account for nearly 90 percent of the U.S. population.
In the tool below, you can toggle between metrics. Each metric has two views: a “Y/Y” approach that compares the most recent three months’ data to the same period last year; or a “vs. 2017-19” option that compares the same recent three-month period against a 2017-2019 baseline to see how the pandemic era has reshaped different parts of the country.
(For the best experience, view the tool on a desktop browser or in landscape mode in mobile.)
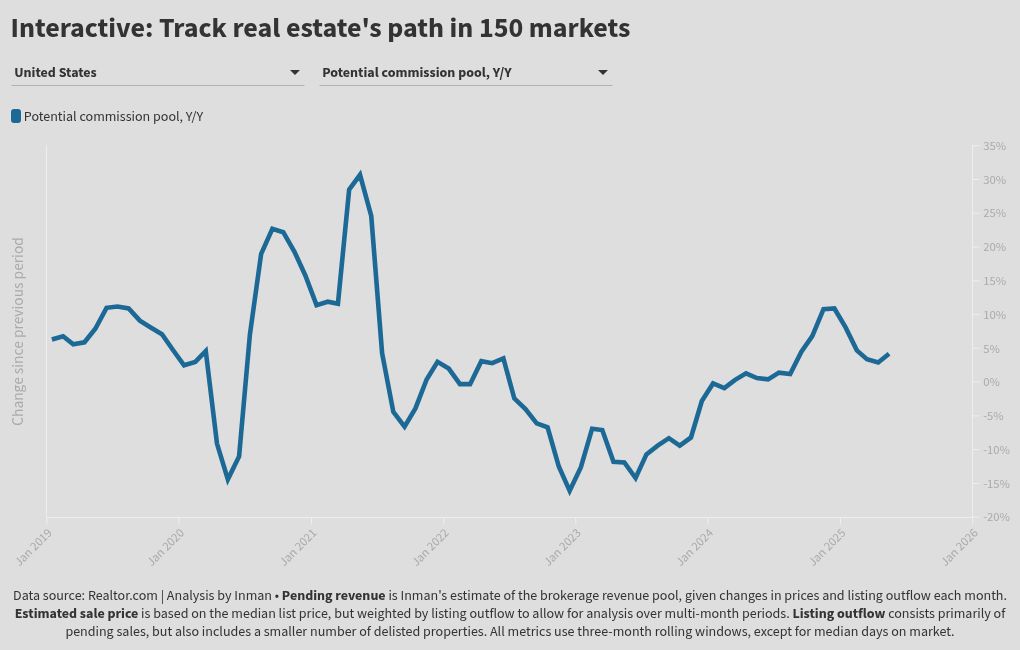
To drill down even deeper into the path each market has taken through the pandemic years, explore the interactive chart tool below.
Use the first dropdown menu to select from any of the nation’s 150 largest housing markets — a collection of metros that contains nearly 75 percent of Americans. Then, use the second dropdown menu to select from the same metrics seen in the map above.
With the tools above, special care has been taken to help account for the occasional noisiness of month-to-month data in small and midsize markets.
By using three-month rolling windows, these tools are able to avoid much of the month-to-month volatility and spot durable trends. And by comparing all recent periods to the same span of time in previous years, the tools account for seasonal patterns in this highly seasonal business.
Each of the metrics above is intended to represent a core concept that Inman tracks on a regular basis. Understand the definitions below to get the most out of the tools.
Metric glossary
Below are the main core concepts that Inman is tracking, and definitions and other notes for each of the metrics.
SUPPLY — New listings
The number of new listings that entered the market in a given month
DEMAND — Listing outflow
The number of properties that left the active-listing pool in a given month, either due to a pending sale or a delisting from the market
This level of listing outflow offsets the number of new listings coming online to explain the total monthly change in the active-listing pool
Note: Delistings are a problematic component of this metric, but cannot be removed due to data limitations. The vast majority of outflowing properties consist of pending sales, and the metric generally tracks closely with sales trends over time. Still, Inman’s listing outflow metric will be less accurate than your local sales data.
INVENTORY SNAPSHOT — Active listings
The total number of active listings on the market that are not marked as “pending” at a given point in time
SPEED OF SALE — Median days on market
The amount of time a typical property sits on the market before it either closes on a sale or is removed from the market
Half of listings spend longer than this on the market, while the other half spend less
Note: This is the only metric in the tools above that is expressed in terms of a single month, instead of a three-month rolling window.
BUYER COMPETITION — Outflow rate per active listing
A market’s listing outflow over a given period, expressed as a share of its active-listing pool at any given time during the same period
This is essentially the inverse of “months supply” — higher outflow rates generally indicate more buyer demand for a typical listing, and higher upward pressure on home prices
PRICE MOVEMENT — Weighted list price
The price level assumed for a given three-month window, using each month’s median list price weighted by each month’s total listing outflow
BROKERAGE REVENUE — Potential commission pool
The value of the estimated pool of commissions that were available to brokerages during a given period, based on list price multiplied by total listing outflow
Note: This metric is blind to important factors that vary by market, such as average commission rates and splits, as well as the number of serious agents competing for business in the area. It’s not adjusted for inflation. It also doesn’t consider how much real estate activity is a result of new construction. The metric best used for a broad overview and tracking trends over time.
The market has undeniably shifted from the extreme seller’s environment of the early pandemic. But in much of the U.S., buyers still face substantial inventory constraints, an Intel analysis shows.
This report is available exclusively to subscribers of Inman Intel, the data and research arm of Inman offering deep insights and market intelligence on the business of residential real estate and proptech. Subscribe today.
The U.S. housing market has entered a new era — one in which homebuyers in most parts of the country actually have more negotiating power than they had before the pandemic.
But the market is also deeply divided.
Broad swaths of the nation now provide far more options for buyers than they were used to even a decade ago. At the same time, the other half of the country remains substantially inventory-strapped, a scenario that supports high prices even as buyers and brokerages fight to wrest new listings from competitors.
These two Americas follow distinct geographic patterns, an Intel analysis of Realtor.com data found.
And while much of the nation still faces severe supply challenges, Intel found that others are rebalancing for the wrong reasons — screeching to a halt as new supply remains depressed amid a listless sales environment.
Intel breaks down where the 150 largest metro areas in the U.S. stand on inventory in this week’s report.
Slow to adjust
To an extent, nearly every market has participated in the ongoing transaction downturn, and the Great Rebalancing of housing inventory that has accompanied it.
But while researching this piece, it became clear that the pandemic’s lasting imprint on local markets remains much deeper in some places than others.
Agents throughout much of the South and the West regions of the United States are seeing conditions where the typical buyer’s pleas to bring down prices now hold more weight.
That doesn’t mean these markets are suddenly buyer’s markets by the traditional definition, where it would take six months or longer for the current stock of inventory to sell in its entirety at present sales rates. Even before the pandemic, inventory had been getting relatively tight, pushing most places into firmly seller-market territory.
But those same places are significantly less seller-friendly today, and it’s weakened price growth in some places and brought prices down in others.
For brokerages, this is a double-edged sword. Lower prices directly cut into a broker or agent’s commissions. At the same time, today’s price levels remain unaffordable for many potential buyers at today’s mortgage rates, which puts a significant damper on sales.
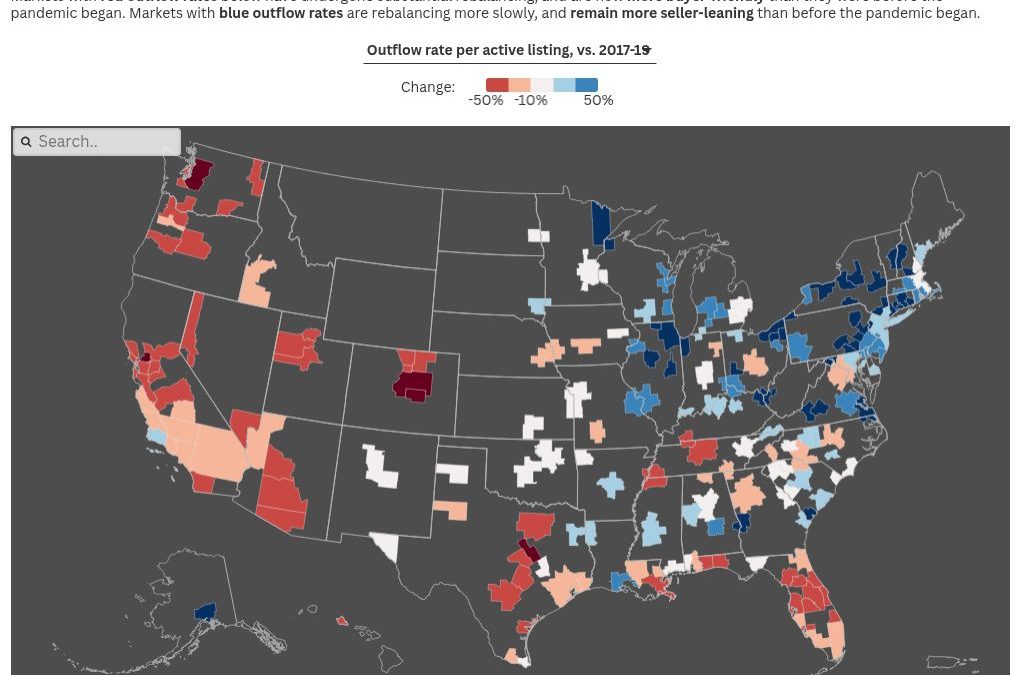
On the other side of the country, agents in the Midwest and Northeast are likelier to see conditions that are rebalancing much more slowly.
Many of these markets remain stuck in an overheated situation, a sort of lingering phantom of the pandemic dynamic where razor-thin inventory is still hard to come by, even in the current depleted buyer pool.
Inside the Great Rebalancing
If roughly half the country is undergoing a significant rebalancing toward more buyer-friendly dynamics, what’s driving it?
There are two main answers, Intel found.
The most unusual path is the one taken by Texas and Florida. In these places, new inventory — including new construction and existing listings — is now coming online each month at a rate that rivals or even exceeds pre-pandemic norms.
These states appear to be benefiting from healthier conditions than what’s being seen in other rebalancing markets, including more inbound migration in recent years.
More new listings helps support more new transactions and demand. And while listings are recovering in most parts of the country, Texas and Florida have been at it for longer, and have reached healthier levels sooner.
Using listing outflow as a rough proxy for sales, transaction levels are also much closer to normal levels in many Texas and Florida markets, even as dynamics have shifted in a more buyer-friendly direction.
In the greater Dallas area, listings are moving off the market at levels that are 94 percent of where they were in a typical spring before the pandemic struck. Houston-area listing outflow is back above normal levels, and San Antonio is back right below its pre-pandemic outflow trend.
So in these places, decent sales volume and a buyer-friendly rebalancing have been able to coexist, offsetting the effect of softening prices for brokerages. But that hasn’t been typical of other parts of the rebalancing nation.
Examining San Diego, listing outflow remains stuck at only 58 percent of its typical levels, while new-listing levels are at 67 percent of normal.
The result is typical of many markets along the Pacific Coast and even deeper inland throughout the West: markets where low transaction levels, rather than robust supply growth, are now creating significantly more buyer-friendly conditions — to an extent that may even threaten price stability.
Here’s how some of America’s biggest population centers fit into four major classes of market.
Rebalanced in large part by healthy supply:
Texas cities: Austin, Dallas, Houston, San Antonio
Eastern seaboard: Tampa, Orlando, Charlotte
Western supply pockets: Denver, San Francisco
Rebalanced primarily by a plummet in demand:
California population centers: San Diego, Los Angeles, Riverside
Other Western cities: Phoenix, Portland, Seattle
Strong competition on decent supply:
Scattered large metros: Pittsburgh, Kansas City
Overheated on short supply:
Northeastern hubs: New York, Philadelphia, Baltimore, Boston
Midwestern metros: Chicago, Cleveland, Cincinnati, St. Louis
This report is available exclusively to subscribers of Inman Intel, the data and research arm of Inman offering deep insights and market intelligence on the business of residential real estate and proptech. Subscribe today.
An immigrant tech worker uncertain about the state of the economy — and their family’s future. A retiree with a suddenly shaky investment portfolio. A homebuyer hit with a shockingly high price tag for needed repairs.
These three stories of real estate transactions gone awry are just a taste of how the tariff fallout is seeping into client decisions and beginning to eat away at the margins of the brokerage industry, agents across the country told the Intel Index survey in May.
As part of its flagship monthly survey of real estate professionals, Intel found that a small but significant share of agents and brokers had already seen a deal blow up because of tariffs.
12 percent of agent respondents and 16 percent of brokerage leaders told Intel that they had already witnessed at least one sale fall apart as a result of the tariffs.
Another 9 percent of agents and 4 percent of brokerage leaders in the survey said that it had not happened to one of their clients, but they had seen it happen to a client of another agent or brokerage in their market.
At this time, most agents surveyed have not yet seen an actual deal fall through for this specific reason alone.
Still, Intel sought these stories to better understand where things might be headed if current tariff levels remain in place — and especially if the temporary reprieves on even higher “reciprocal” tariffs are allowed to expire.
Agents and brokerage leaders said that the primary effect so far has been psychological — but a number of clients have been materially affected by tariffs as well.
“The tariff noises are unpredictable and chaos is reigning, which is creating an environment of instability and uncertainty in my buyers,” wrote one decision-maker at a brokerage on New York’s Long Island.
In this week’s report, Intel breaks down the most frequently cited tariff-related obstacles that real estate professionals are running across.
Wide-ranging experiences
Real estate agents whose business has been affected by tariffs reported numerous reasons given by clients.
Roughly half of the agents who told Intel that tariffs had tanked a deal in their market said that they had seen at least one instance where the client had not yet been directly impacted by tariffs, but worried they would be in the weeks to come.
This type of general fear and uncertainty, even before any direct impact was felt, was the most common scenario that these agents witnessed killing a sale.
One agent in Charlottesville, Virginia, reported to Intel that they had seen multiple deals fall apart in March and April.
At least one of this agent’s clients used HOA documents as an excuse to back out, but “later admitted the entire reason was economic uncertainty,” the agent wrote.
In Austin, an agent told Intel they were aware of another agent’s client who backed out because he or she was increasingly fearful of both tariffs and deportation when they backed out of a home search.
The client, who worked in tech, had lived in the U.S. for more than three decades, raised children that were born here and had proper documentation, the agent said.
But it’s not just fear of a hypothetical outcome that’s giving some buyers cold feet.
The government’s ever-changing tariff policy hit financial markets particularly hard in April, with the S&P 500 falling 12 percent in value in the days after the Trump administration’s April 2 announcement of so-called “reciprocal” tariffs.
Since then, markets have recouped most of their losses from that early period as the Trump administration paused a number of the highest tariff rates and signaled a willingness to strike deals with trading partners.
But for a number of agents who had a deal on the line in April, the damage was done.
More than 4 in 10 agent respondents who had seen tariffs tank a deal told Intel that a client had lost income from, or value within, their stock investment portfolio before backing out of a deal.
Actual job loss due to tariffs was rarely cited as a reason for a deal falling through in the earliest weeks of tariff implementation.
But loss of income or business revenue in a trade-dependent field was a relatively frequent issue for the clients who did back out, agents said. And some clients even told their agents that tariffs had already begun to push up their cost-of-living.
Another agent from New York City said one of their clients backed out of a deal after learning how high tariffs had pushed the cost of renovating the property.
This general experience was shared by 1 in 5 of the affected agents, who said they had seen tariffs raise the cost of a newly built home outside a client’s price range.
Here’s the full text and responses to Intel’s question from agents who said they’ve seen a sale fall apart due to tariffs.
Intel: You mentioned you’ve seen the tariffs contribute to at least one lost sale in your market. Which of the following scenarios have come up? Select all that apply.
49 percent — Client was not directly impacted by new tariffs, but expressed concern that they might be in the months to come
42 percent — Client lost income from, or value within, a stock investment portfolio
30 percent — Client did not lose a job, but lost income or business revenue in an industry reliant on international trade
26 percent — Client cited rising household expenses from new tariffs
21 percent — Client backed out of a search for new construction listings because of increased costs of material goods due to tariffs
18 percent — Client lost a job in an industry reliant on international trade
For now, new tariffs in imports remain a relatively rare cause of a busted purchase or sale. And based on financial market movement in recent weeks, investors appear to be increasingly convinced that the new levies will not remain in place long-term, or will not be pushed as high as once feared.
But the longer that they remain in place, and the likelier it becomes that the pauses on higher rates are allowed to expire, the more that cases like these may creep further into the mainstream.
For some brokerage decision-makers, that’s already the reality.
“The propensity for a negative business environment outweighs the indicators of positive views looking forward,” the Long Island brokerage leader wrote, “and this is directly related to tariffs, and mayhem around them.”
Methodology notes: This month’s Inman Intel Index survey was conducted May 20-June 3, 2025, and received 529 responses. The entire Inman reader community was invited to participate, and a rotating, randomized selection of community members was prompted to participate by email. Users responded to a series of questions related to their self-identified corner of the real estate industry — including real estate agents, brokerage leaders, lenders and proptech entrepreneurs. Results reflect the opinions of the engaged Inman community, which may not always match those of the broader real estate industry. This survey is conducted monthly.
Real estate agents reported an unexpected hit to their listing pipelines in May as they navigated an uncertain market and weak spring, according to the latest Inman Intel Index survey results.
This report is available exclusively to subscribers of Inman Intel, the data and research arm of Inman offering deep insights and market intelligence on the business of residential real estate and proptech. Subscribe today.
Over the past two years, a slow but steady flow of new real estate listings has crept back into the market, offering a slight boost of new business for brokerages and a welcome expansion of options for their buyer clients.
But as the spring market draws to a close, some agents told Intel that their listing pipelines have suffered an unexpected hiccup.
The setback in listing-client interest was offset by newfound hopes that buyers might become easier to find amid a series of pauses in U.S. tariff policy, according to Intel’s Client Pipeline Tracker update for the month of May.
The result? A market that’s essentially still stuck in limbo as it faces broad uncertainty — and few immediate prospects for a quick turnaround.
Client Pipeline Tracker score in May: +1
Previous score: +1 in April
Recent high point: +9 in January
Chart by Daniel Houston
This inventory stumble is just the latest setback for real estate agents, whose hopes for a more robust spring buying season had fallen back to Earth in many parts of the country.
Intel explores these complex dynamics in more detail in its latest Client Pipeline Tracker report.
A spring retrospective
Intel’s Client Pipeline Tracker is a compilation of how agents feel about their buyer and seller pipelines — both over the past year and in the near future.
Intel described the methodology in this post, but here’s a quick refresher on how to interpret the scores.
A score of 0 represents a neutral period in which client pipelines are neither improving nor worsening.
A positive score reflects a market in which client pipelines have been improving, or are widely expected to improve in the next 12 months. The higher the rating, the more confident agents are in that conditions are moving in a positive direction.
A negative score suggests client pipeline conditions are worsening, or are widely expected to get worse in the year to come.
An extremely positive combined score falls somewhere around the +20 mark. This type of score would signify that much of the industry is in agreement with the fact that pipelines are improving and will continue to improve.
An extremely negative combined score, on the other hand, falls closer to -20. That’s a bit lower than where the industry stood in September 2024, the first time Intel surveyed agents about their pipelines.
For each of the four individual components that go into the score, results as high as +50 or as low as -50 are sometimes observed.
Here are the component scores from the most recent survey, and how each sentiment category changed from the previous one.
Tracker component scores
April → May
Present buyer pipelines: -27 → -26
Future buyer pipelines: +5 → +10
Present seller pipelines: -3 → -10
Future seller pipelines: +13 → +12
As the spring came to a close, the Intel survey found clear signs that agents were disappointed with how their client pipelines developed.
From late February to late May, the share of agents who responded to the Intel Index reported a year-over-year thinning of their buyer pipelines rose from 45 percent to 51 percent.
The share of agent respondents who saw a year-over-year decline in listing client conditions crept up from 34 percent to 42 percent over the same span of time — with the most notable leap in negative sentiment occurring from April to May.
Despite this disappointing season, agents remain cautiously optimistic that a slightly better year may be on the way.
39 percent of agent respondents told Intel in May that they expected to be working with a bigger buyer client pool a year from now — although only 5 percent of all agent respondents were expecting a big improvement.
These numbers are essentially unchanged from before the spring market kicked into higher gear — a potential sign that despite the relatively slow season, agents are not viewing it as a harbinger of worse conditions ahead.
A rebalancing act
Real estate agents surveyed by Intel the previous month reported widespread concern about the direction of the economy — but not much change in their prospects of attracting clients.
In fact, agents in April did not seem to meaningfully lower their expectations even after the Trump administration announced a slew of new so-called “reciprocal” taxes on imports.
It’s notable then that after many of those tariffs were reduced temporarily, agents did meaningfully increase their expectations for buyer client pipelines in the 12 months ahead.
Only 17 percent of agent respondents told Intel in May that they expected their buyer pipelines to be lighter a year from now, compared to 23 percent who shared that pessimistic outlook the month before.
This drop in pessimism was a big factor in offsetting the month-to-month weakening in listing pipelines in this month’s Client Pipeline Tracker update.
But beyond those numbers, agents don’t seem to buy that any short-term drop in listing pipelines will hold up amid a market that for years now has experienced persistent momentum behind a gradual replenishment of its supply of available homes.
The number of new listings that entered the market in April was 9 percent higher than the same month last year and 22 percenthigher than the same time the year before that, according to listing data from Realtor.com.
Still, even after multiple years of upward momentum, this influx of new supply was 15 percent below prepandemic levels from April 2019.
Ultimately, while a rising supply of homes may help nudge brokerage revenues upward in some markets and offer buyers some extra negotiating power, agents are likely waiting for bigger declines in mortgage rates before getting their hopes up.
Methodology notes: This month’s Inman Intel Index survey was being conducted May 20-June 3, 2025, and had received 494 responses as of Friday morning. These results are preliminary and may be revised. The entire Inman reader community was invited to participate, and a rotating, randomized selection of community members was prompted to participate by email. Users responded to a series of questions related to their self-identified corner of the real estate industry — including real estate agents, brokerage leaders, lenders and proptech entrepreneurs. Results reflect the opinions of the engaged Inman community, which may not always match those of the broader real estate industry. This survey is conducted monthly.
New insights from the Inman Intel Index survey show how life is different these days — and often tougher — for indie brokerages than it can be for their big-brand competitors.
This report is available exclusively to subscribers of Inman Intel, the data and research arm of Inman, offering deep insights and market intelligence on the business of residential real estate and proptech. Subscribe today.
Agents and executives at indie brokerages take a lot of pride in their business models, their independence and their ability to nimbly respond to new challenges.
But their leaders also acknowledge that today’s market conditions are a bit tougher for their preferred way of doing business, new results from the Inman Intel Index survey suggest.
Leaders at privately owned independent brokerages are more likely to report downward pressure on their commission rates, weaker confidence in their business models and greater reluctance to prepare for higher transaction levels than their counterparts in bigger real estate networks, according to results from April’s survey.
And their differing paths through this market also have implications for brokerage hiring, recruiting and M&A decisions, Intel found.
For this report, Intel, in April, sought the perspectives of more than 100 broker-owners, executives and investors at real estate firms across the country.
Their perspectives on a wide range of questions were then broken down by their brokerage’s affiliation — franchises and other big brands on the one hand and private indies on the other.
The full findings are available in this week’s report.
Diverging experiences
Since the NAR settlement rules went into place last August, a number of real estate professionals have reported that declines in their compensation rates have been real, albeit fairly small.
But the latest Intel survey finds that commissions have been a bit steadier for brokerages that are part of a larger network.
37 percent of surveyed leaders at brokerages affiliated with franchisors or publicly traded brands reporting commissions have decreased at least slightly since the new rules went into effect.
Compare that to 52 percent of private indie leaders who have made the same observation.
The reason for this difference is unclear.
But as a result, leaders of private indie firms are more likely than others to name “margin compression” as their top concern, while brokerage leaders in bigger networks point to recruiting and macroeconomic factors as more pressing headaches.
There’s also some evidence in the survey that those brokerages affiliated with bigger networks may be in a better position to respond quickly to a potential upswing in transaction activity, when it arrives.
Leaders at firms in large networks are more likely to say they’ve increased headcount over the past year — and more likely to say that’s likely just the start of their hiring efforts.
35 percent of leaders surveyed at bigger brand brokerages said they had a higher headcount in April than at the same time last year. Only 18 percent of private indie leaders said the same.
Meanwhile, 74 percent of leaders at big-brand-affiliated operations told Intel that they expected their company’s headcount to be higher next year than it is today, compared to 53 percent of private indie leaders who provided the same response.
Generally, brokerage leaders said they felt that their businesses were well-positioned for the market challenges they face today. But leaders at firms affiliated with bigger brands were more likely to report that they were especially confident in their business model.
41 percent of surveyed leaders in bigger brokerage networks expressed total confidence in their business model, a bit higher than the 30 percent of surveyed leaders at private indies who said the same.
Still, most leaders in both groups felt their business model was adequate for today’s market conditions. Only 13 percent of leaders from big networks and 12 percent of leaders at private indies reported having low confidence in their business models.
Through the lens of these two very different experiences and outlooks within the same down market, brokerage leaders also described differing expectations for how their firms would proceed in the year ahead.
Implications for deals
Intel also asked brokerage leaders about how actively their leadership teams are fielding mergers and acquisitions today, and how active they expect negotiations will be a year from now.
Across the board, smaller brokerages were less likely to be actively discussing M&A.
Only 37 percent of surveyed leaders at private indies said that M&A was even remotely on the radar in April, compared to 70 percent of leaders at brokerages with bigger brands.
16 percent of leaders at private indies told Intel they expected M&A talks at their brokerage to be likely 12 months from now, compared to 41 percent of leaders at bigger firms.
Of those brokerage leaders who said M&A is an active consideration in the year to come, most were primarily interested in acquiring other brokerages, not being acquired or merging with another firm. But smaller indie brokerages were open to a wider array of potential deals — including selling.
In most cases, the possibility of their ownership selling was not expected to be due to an impending retirement of the broker-owner.
Twice as many respondents at private indies said that they expected their owner to stay on in a leadership role if the brokerage was sold, compared to members of the same group who expected their owner might retire.
Broker-owners and executives at small private indies were also more likely to see M&A as an opportunity to expand market share within their existing territory, and no more likely than larger-network firms to eye an expansion into new markets.
Methodology notes: This month’s Inman Intel Index survey was conducted April 17-May 2, 2025, and received 428 responses. The entire Inman reader community was invited to participate, and a rotating, randomized selection of community members was prompted to participate by email. Users responded to a series of questions related to their self-identified corner of the real estate industry — including real estate agents, brokerage leaders, lenders and proptech entrepreneurs. Results reflect the opinions of the engaged Inman community, which may not always match those of the broader real estate industry. This survey is conducted monthly.