Those business generating free cash flow are best-positioned for growth, shareholder returns and value-added new ventures, Mike DelPrete writes.
This article was shared here with permission from Mike DelPrete for Inman Intel, a data and research arm of Inman offering deep insights and market intelligence on the business of residential real estate and proptech. Subscribe today.
Profitability can be reported in a variety of ways: net profit, EBITDA, adjusted EBITDA, adjusted net profit, gross profit, and cash in the bank are just a few possible metrics.
Why it matters: While each is important, none really measures the actual profitability of the core operating business model.
Because before debt repayments, stock buybacks, and acquisitions, what really matters is how much cash the business generates, and that metric, buried in the cash flow statement, is net cash provided by operating activities.
Using net cash provided by operating activities as the baseline, it’s possible to compare the business models and relative profitability of the top publicly listed real estate companies.
The measure here is business model efficacy – cut through the hype, misleading metrics, and adjacent financial maneuvering to look at the core business: does it make money?
In 2023, Zillow and eXp Realty, followed closely by Anywhere, were all cash-generation machines.
Zillow often gets lambasted as being “unprofitable” (on a net profit basis) and eXp’s business model has been questioned for years, but both generate a lot of cash.
Opendoor’s financials are unintentionally obfuscated behind the massive cash inflows and outflows of buying and selling real estate – this analysis excludes those cash flows for all iBuying activities.
Historically, these companies are generally either consistently profitable or unprofitable.
Zillow, HomeServices of America, eXp and, for the most part, Anywhere, have all been profitable since 2018, with 2021 a notable highpoint.
Opendoor, Compass and Redfin have all been generally unprofitable during the same period (Redfin was briefly profitable in 2020 and 2021).
Over the past six years, the most profitable companies have deployed their free cash in very different ways.
Zillow and Anywhere, two very different companies whose only similarity is that they’re both in real estate, have each generated about $2 billion in cash since 2018.
Zillow used that cash to grow, investing over $1 billion in acquisitions, while Anywhere used it to pay off about $1 billion in debt (only $2.3 billion to go!).
The same trends continue into 2024 with Zillow and eXp continuing to generate large amounts of cash, with a few other noteworthy outliers.
Compared to the same time last year, the biggest improvement in cash flows has been at the most unprofitable companies (Opendoor, Compass, and Redfin), which have been energetically cutting costs and reducing expenses.
The large Q1 cash burn at Anywhere is seasonal and highlights the fluctuations of a traditional brokerage business (eXp, however, still generated cash).
The bottom line: It may sound elementary, but a real business needs to have a business model that works — and that’s consistently making more money than it spends.
It is those businesses — generating free cash flow — that are able to invest for growth, give returns to shareholders, and use the profits to launch new ventures to add value to the real estate ecosystem.
Even with plenty of cash in the bank, companies whose core business is unprofitable are much more constrained in their operations and can’t survive forever; either the business model pivots or the company will cease to exist.
Mike DelPrete is a strategic advisor and global expert in real estate tech, including Zavvie, an iBuyer offer aggregator. Connect with him on LinkedIn.
This article was shared here with permission from Mike DelPrete for Inman Intel, a data and research arm of Inman offering deep insights and market intelligence on the business of residential real estate and proptech. Subscribe today.
A number of real estate tech companies have ambitions to grow mortgage businesses, and results from the past year highlight which companies are actually gaining market share.
Why it matters: The data shows, in very real terms, what “investing for growth” really means, and which companies are best positioned to grow mortgage as a meaningful adjacency.
Zillow is the standout, doubling its MLO (mortgage loan originator) headcount over the past 14 months — during a very difficult time to be in mortgage.
In a down market, it’s rare for a company to double its mortgage headcount.
But one other company has done so, seemingly back from the abyss: Better Mortgage.
After shedding over 1,000 MLOs during the dark days of 2022, Better is back — or at least investing for growth — by doubling its MLO headcount over the past year.
Redfin has slowly shed MLOs since its acquisition of Bay Equity Home Loans in 2022.
Like Zillow, its goal is to attach mortgage services to its core brokerage operation, but in contrast to Zillow, its headcount is shrinking (down 30 percent since acquisition).
More MLOs correlate to more funded loans: Comparing the two portals over the past year, Zillow has more than doubled its loan origination volume, while Redfin’s has slightly declined.
Redfin’s mortgage business is still larger than Zillow’s, but unlike Zillow, it’s not growing.
The bottom line: My latest podcast guest, Greg Schwartz, CEO of Tomo and former president at Zillow, summed up the situation well: “Growth is in our control.”
Mike DelPrete is a strategic advisor and global expert in real estate tech, including Zavvie, an iBuyer offer aggregator. Connect with him on LinkedIn.
This article was shared here with permission from Mike DelPrete for Inman Intel, a data and research arm of Inman offering deep insights and market intelligence on the business of residential real estate and proptech. Subscribe today.
The number of homes listed for sale and then delisted — taken off the market without selling — is rocketing to all-time highs.
Why it matters: Rising delistings are a sign of a pricing imbalance, with asking prices higher than what buyers are willing to pay.
National delistings, as a percentage of total listings, are roughly double the normal rate, bucking seasonal trends, and accelerating rapidly.
It all starts with pricing — and new listings coming to market are being priced very high.
The median price per square foot on new listings is at record highs.
Another sign of a pricing imbalance are price drops, the number of which are also rising.
The percentage of active listings with price reductions is higher than it’s been for years, and is increasing.
And for the houses that are selling, it’s taking longer.
The median number of days on market is slowly increasing and is higher than past years.
The bottom line: The surge of new listings coming to market are overpriced, leading to a rapidly increasing number of delistings and price drops.
This is the start of a price correction; sellers are bringing more inventory to market, but with “aspirational pricing” that buyers are not willing to pay.
The record number of pricing corrective measures will likely lead to an overall correction – lower prices – as supply and demand continues to rebalance.
Mike DelPrete is a strategic advisor and global expert in real estate tech, including Zavvie, an iBuyer offer aggregator. Connect with him on LinkedIn.
Homes.com appears to have solidified its place as the No. 2 portal in the U.S. market, without a corresponding decline in traffic at any other portal.
Why it matters: Portal traffic appears to be a non-zero-sum game — traffic gained by one portal is additive and not coming at the expense of other portals.
Dig deeper: In the first quarter of 2023, the big three real estate portals — Zillow, Realtor.com, and Redfin — had a combined 334 million average monthly unique visitors.
Fast forward to the first quarter of 2024 and those same portals have a combined 338 million average monthly uniques — no change — with Homes.com growing to an additional 94 million average monthly uniques.
And that’s just for Homes.com — if you include CoStar’s entire residential network, which includes Apartments.com, the scale is even greater.
It’s a valid comparison; the other portals also include traffic from a larger network of sites, including rentals.
The result is that CoStar’s resi network has nearly double the traffic of Realtor.com.
CoStar’s traffic reporting hasn’t been consistent — it has fluctuated between Homes.com and the entire residential network, and sometimes includes quarterly averages and other times specific months.
CoStar’s inconsistent reporting runs the risk of reducing trust in its traffic numbers, even when the underlying results are impressively real.
But traffic has unequivocally increased over the past year, punctuated by two periods of heavy advertising.
CoStar’s advertising spend reached an all-time high in Q1 2024 — which directly corresponds to the recent traffic surge in February and March.
The bottom line: While Homes.com’s traffic increase is additive to the market and not affecting other portals’ traffic, that’s not to say it won’t affect their businesses.
Unlike website visits, there is a finite amount of transactions, commission dollars, and agents willing to spend money online; that’s a zero-sum game.
While 2024 is looking like more of the same down market, leading indicators may point to happier days ahead, according to Mike DelPrete.
This article was shared here with permission from Mike DelPrete for Inman Intel, a data and research arm of Inman offering deep insights and market intelligence on the business of residential real estate and proptech. Subscribe today.
Compared to last year, new listings are up and existing-home sales are down — a tale of two metrics — but with a promising silver lining.
Why it matters: New-listing volumes are a leading indicator for existing-home sales, which typically lag by two to three months, meaning the current surge in new listings is a hopeful sign for the remainder of the year.
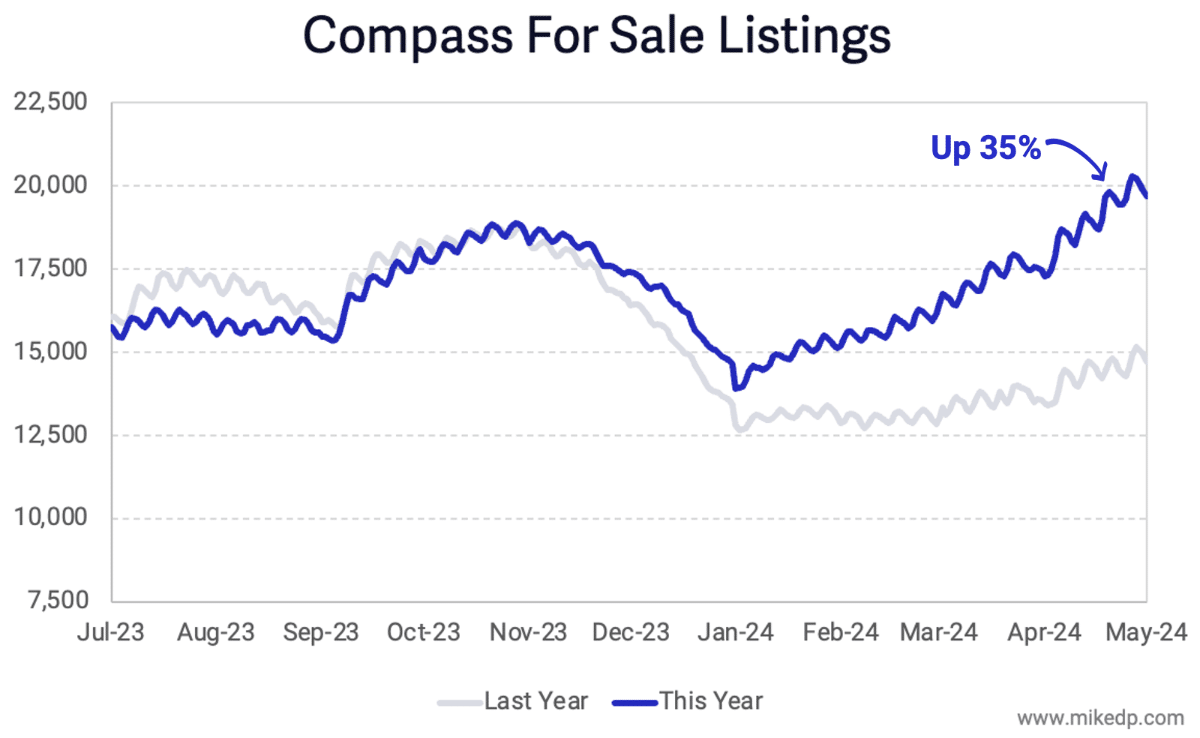
Data points: Compass has 35 percent more listings than the same time last year — a trend which has been steadily increasing since January — with about the same number of agents.
Nationally, new listings are up about 15 percent compared to last year, according to Redfin data (which measures all listings in a market, not just Redfin’s listings).
New listings aren’t quite at the levels of 2021 and 2022, but are well off the lows of 2023, meaning inventory is building.
But new listings are not yet translating into sales, which is reported monthly by the National Association of Realtors.
After a relatively steady start to the year, existing home sales in March were down 10 percent compared to 2023, and down 19 percent compared to the historical average.
For the first quarter of 2024, existing home sales were down 17 percent compared to the pre-pandemic historical average (2012–2019).
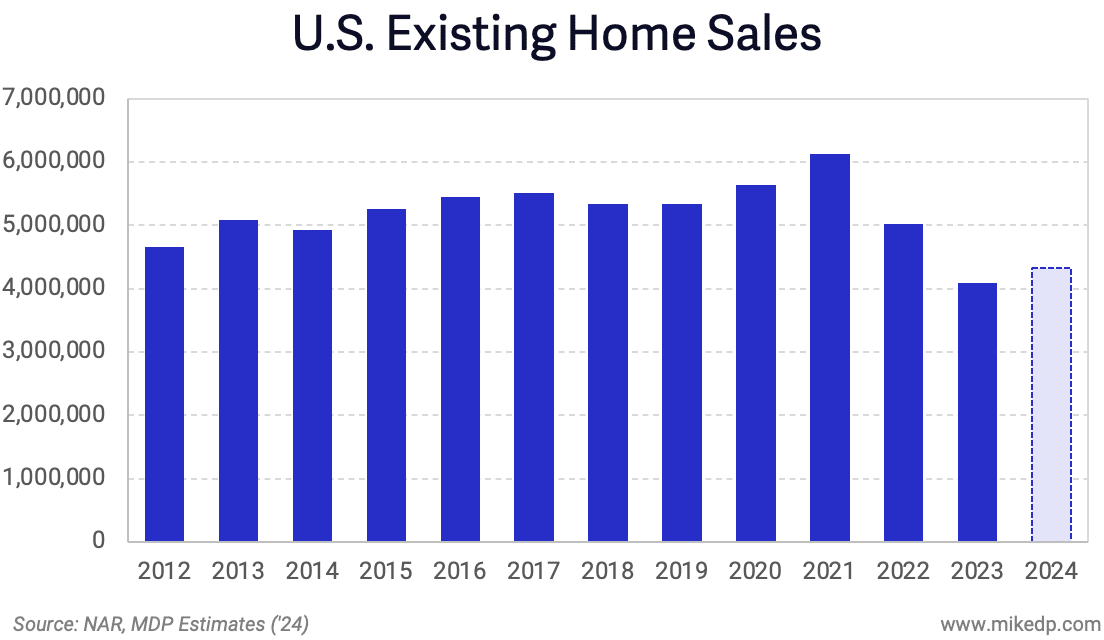
At this rate, total transactions for 2024 would end up at 4.3 million, up 6 percent from last year.
What to watch: I think it has something to do with interest rates.
But also keep an eye on days on market to make sure inventory isn’t just sitting on the market (sellers without buyers).
The bottom line: It’s a confusing time with mixed messages coming from the market, making it easy to spin whatever narrative you want (armageddon vs. a healthy recovery).
There’s no simple answer to what’s going on, just data: new listings are up significantly and sales are lagging.
2024 will likely be another depressed year of activity, but the best leading indicator of future activity, new listings, is looking promising.
Mike DelPrete is a strategic adviser and global expert in real estate tech, including Zavvie, an iBuyer offer aggregator. Connect with him on LinkedIn.

 Profitability can be reported in a variety of ways: net profit, EBITDA, adjusted EBITDA, adjusted net profit, gross profit, and cash in the bank are just a few possible metrics.


 A number of real estate tech companies have ambitions to grow
  In a down market, it’s rare for a company to double its mortgage headcount.
 Redfin has slowly shed MLOs since its acquisition of Bay Equity Home Loans in 2022.
 More MLOs correlate to more funded loans: Comparing the two portals over the past year, Zillow has more than doubled its loan origination volume, while Redfin’s has slightly declined.


 CoStar’s advertising spend reached an all-time high in Q1 2024 — which directly corresponds to the recent traffic surge in February and March.
 The bottom line: While Homes.com’s traffic increase is additive to the market and not affecting other portals’ traffic, that’s not to say it won’t affect their businesses.

 Nationally, new listings are up about 15 percent compared to last year, according to
 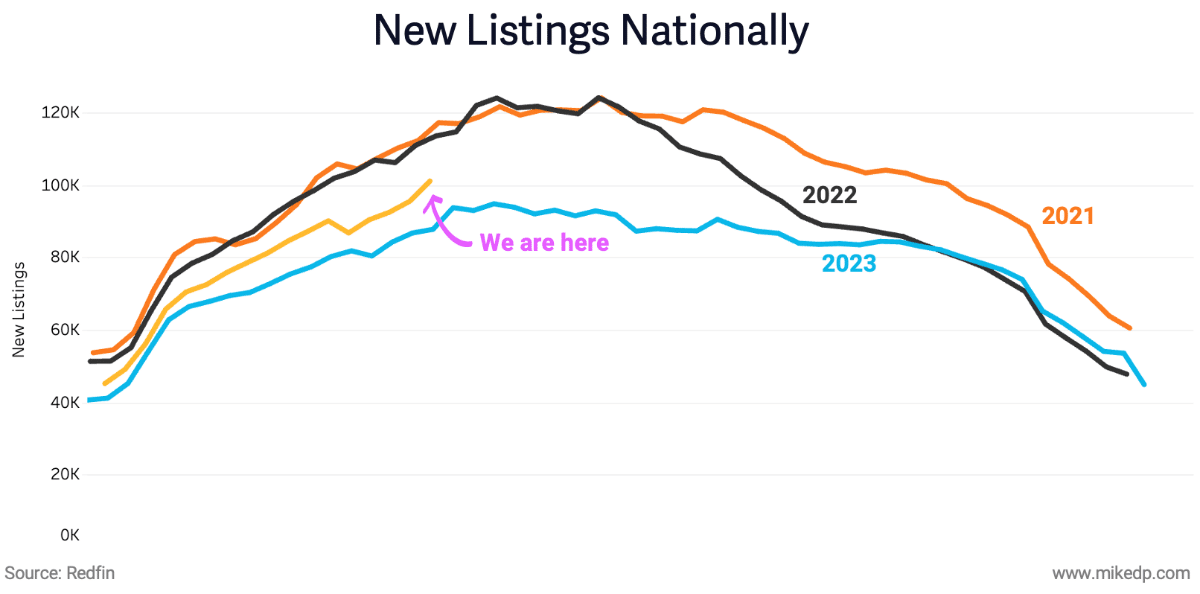 But new listings are not yet translating into sales, which is
 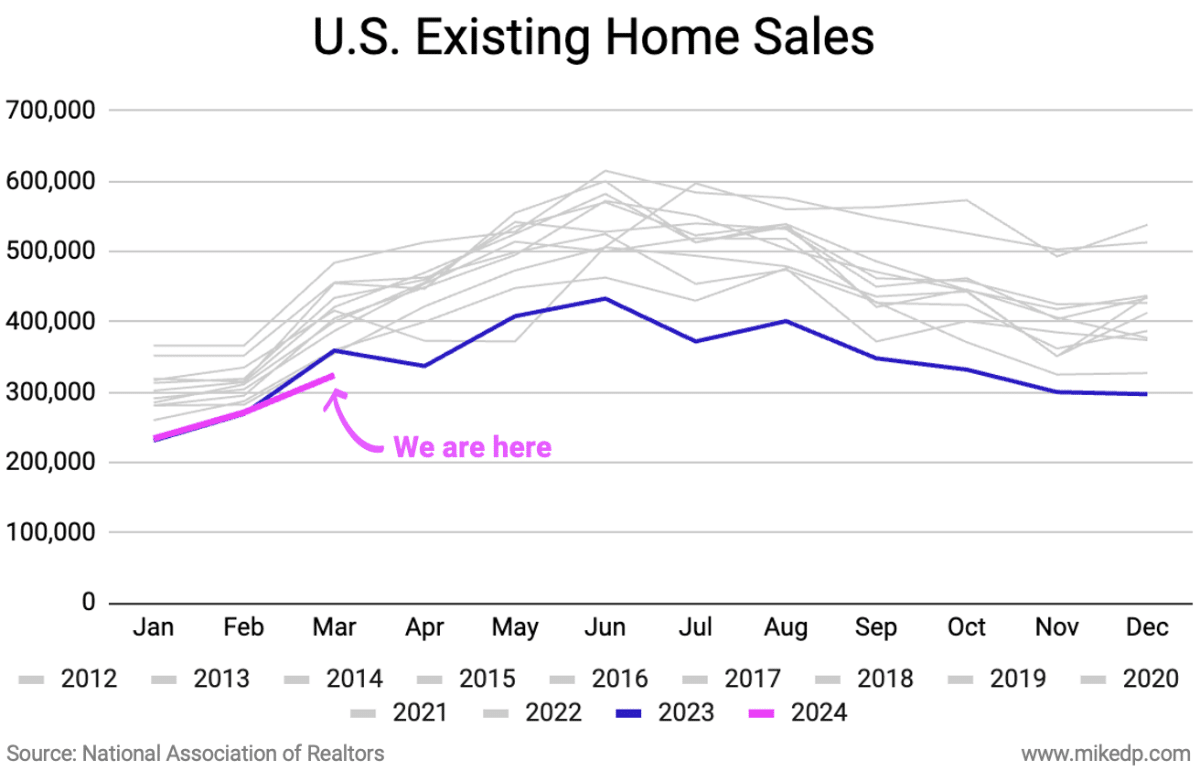 For the first quarter of 2024, existing home sales were down 17 percent compared to the pre-pandemic historical average (2012–2019).